When the gold rush commenced in 1848 California's native population was approximately 110,000. There were also some 7,000 persons of Mexican and Spanish descent, 700 Americans, and 200 Europeans.1 In 1850, a year after California's admission to the United States and with the gold rush in full bloom, the first state census put California's white population at 92,597. The native population had decreased to about 30,000 as a result of disease, starvation, and murder.
At the heart of the Mother Lode, El Dorado County experienced its own population boom to bust as a result of the gold rush. In 1850 over one fifth of the state's white population lived in the county. A decade later the state's population had grown to almost 380,000 while that of El Dorado County was virtually unchanged. The rush to the golden county of the golden state was over just a decade after it started. As the table at right suggests the county's population declined during the remainder of the nineteenth century and into the twentieth reaching a low of 6,426 in 1920 before it began to grow again.
El Dorado County's changing demographics over the last 50 years are the focus of the activities below.
Boom to Bust2
| Year | California | El Dorado County |
|---|---|---|
| 1850 | 92,597 | 20,057 |
| 1860 | 379,994 | 20,562 |
| 1870 | 560,247 | 10,309 |
| 1880 | 864,694 | 10,683 |
| 1890 | 1,213,398 | 9,232 |
| 1900 | 1,485,053 | 8,986 |
| 1910 | 2,377,549 | 7,492 |
| 1920 | 3,426,861 | 6,426 |
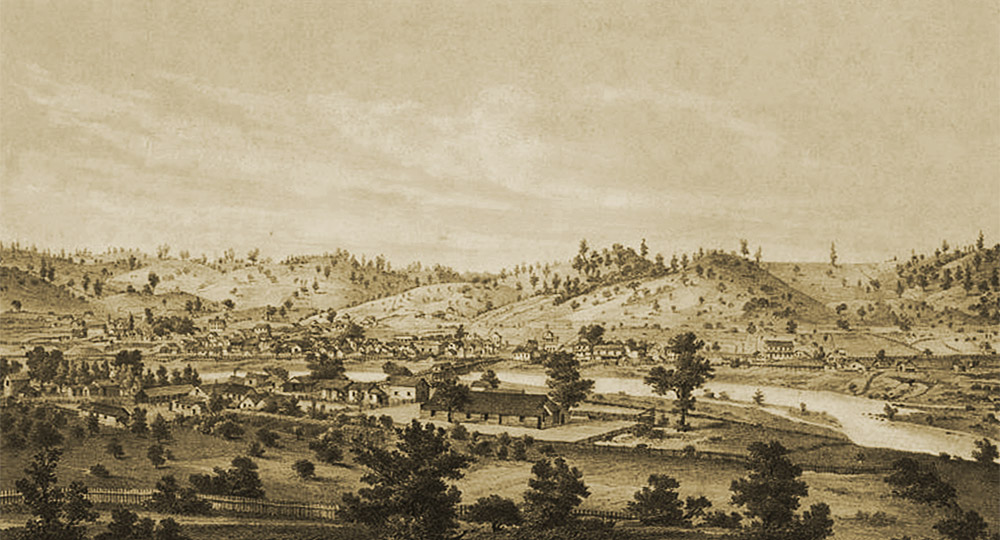
The town of Coloma, near Sutter's Mill where gold was first discovered in 1848 grew to become the home of thousands in the 1850s. Today it is the home of the Marshall Gold Discovery State Historic Park and a population of a few hundred.
The area of El Dorado County is just over 1700 square miles. It extends from its western boundary in the Sacramento Valley east into the Sierra Nevada foothills and the mountains themselves to its eastern boundary on Lake Tahoe and the Nevada border. How has the population density of the county (the number of persons per square mile) changed over the years? You could do a gross calculation based on the county's total population and area to check. In 1920, for example, when there were 6,426 people in 1,710.8 square miles. The population density was only 6426/1710.8 = 3.8 people per square mile. Very sparse. Of course most people lived in and around the county's towns. Data from census tract files will give a more finely focused picture.
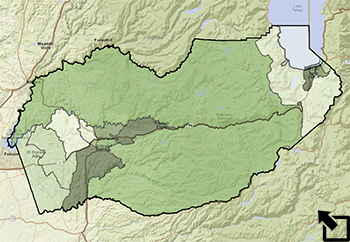
Open the El Dorado: Demographics map and make sure that just the El Dorado County - 1970 layer is turned on.
Change Style and map Population Density for 1970 classifying by color with 5 quantiles so that the result looks like the map at the right. This will give you five groups with approximately the same number of census tracts per group. Next, prepare a similar map for each decade from 1980 thru 2010 that you can examine chronologically looking for changes over time.
1) Where are the areas of greatest population density in El Dorado County over the period from 1970 to 2010?
2) How does the population density of El Dorado County compared with that of surrounding counties? (HINT: Check the data in the California Counties layer.)
3)The ethnic make-up of California has changed dramatically over the last fifty years - particularly with increases in the Hispanic population. To what extent has this statewide trend been mirrored in El Dorado County? The pop-up for each census tract contains a Pie Chart showing the ethnic makeup of each tract. Notice that the data in the chart is normalized using the total population. This means that the population for each group has been divided by the tract's total population and that you will see a percentage for each ethnic group as you roll over its section of the graph. Use the graphs to explore and summarize the change in the county's Hispanic population since 1970.
4) Where in El Dorado County is the change in the ethnic/racial composition of the population the greatest? Explain.
5) A population pyramid is a graphic display of age and gender data. The Population Pyramid worksheet provides a chance to learn about this tool and apply it to better understand how demographic patterns can be applied in county planning.
1David J. St. Clair, "The Gold Rush and the Beginnings of California Industry," in James J. Rawls and Richard J. Orsi, editors, A Golden State: Mining and Economic Development in Gold Rush California, (Berkeley: University of California Press, 1999.
2Campbell Gibson and Kay Jung, "Historical Census Statistics on Population Totals By Race, 1790 to 1990," (Washington, D.C.: U.S. Census Bureau, 2002)
image cropped from George Searle, lithographer, Coloma, 1857, El Dorado County, California, San Francisco: Britton & Rey, 1857 in Calisphere.