
| Decade | 1820 | 1830 | 1840 | 1850 | 1860 |
|---|---|---|---|---|---|
| Irish Immigrants | 51,617 | 170,672 | 656,145 | 1,029,486 | 427,419 |
| Irish Population | 6.8 million | 7.8 million | 8.2 million | 6.6 million | 5.8 million |
The immigrants who arrived in the United States in the late 1840s and 1850s were not a cross section of the Irish population. The two ships's manifests below provide a picture of the background of typical immigrants arriving in New York as a result of the potato famine. Columns in the tables can be sorted by age, sex, and occupation allowing you to study the characteristics of this population in more detail. Perhaps you will even find your own family name.
Manifest of the Barque Archimedes |
Manifest of the Brig General Scott |
|
|
|
|
To sort columns - click on the arrow in the column heading
and select to Sort ascending or Sort
descending |
|
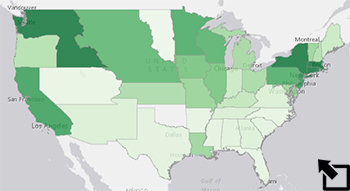
As the map at the right suggests the largest numbers of Irish immigrants coming into the United States as a result of the potato famine settled in two states - Massachusetts and New York - and actually in two cities - Boston and New York City. Wise newcomers like Margaret McCarthey recommended to family back home that they come with enough money to escape the cities and to be able to move west where the opportunity to acquire jobs and land was greater. Most could not. The emigration from Ireland took their entire fortune. Port cities like Boston, New York, Philadelphia, and New Orleans became overwhelmed with the new arrivals from Ireland and the disease and poverty they brought with them.
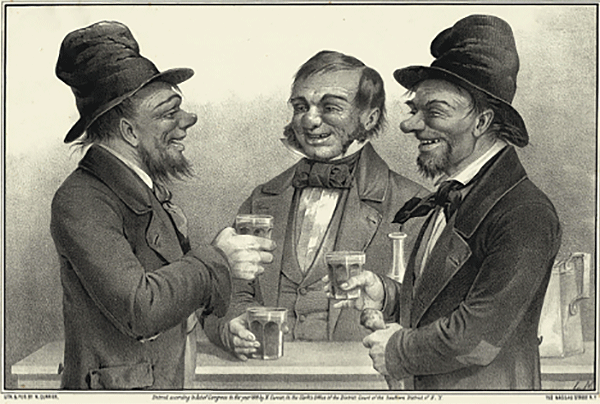
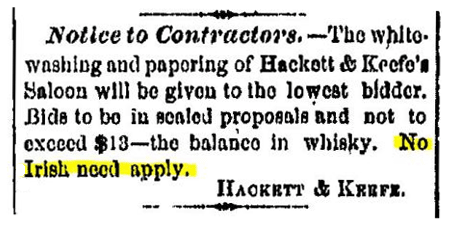
New immigrants were more often than not confined to the slums and tenements in the poorest neighborhoods - not always happy with their decision to emigrate as this letter from William Dever suggests. Stereotypes of the Irish made the Atlantic crossing as well - happiest with a drink in hand, lazy, and potentially violent - all contributing to an unwillingness in some quarters to hire an Irishman.
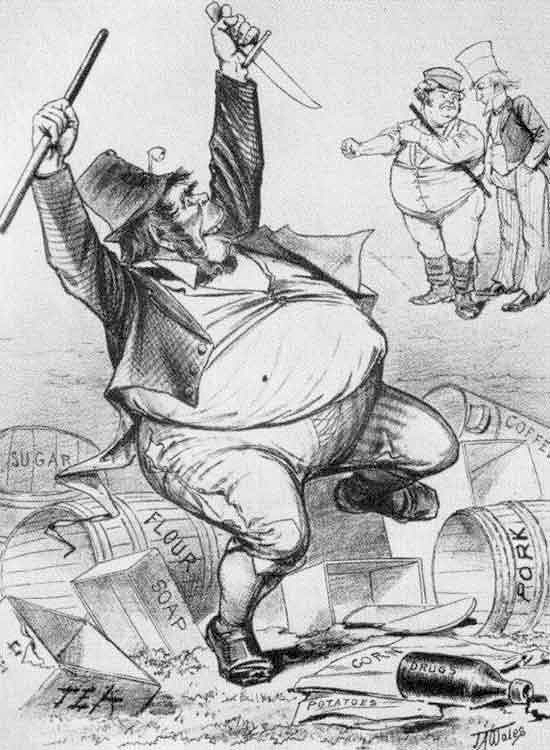
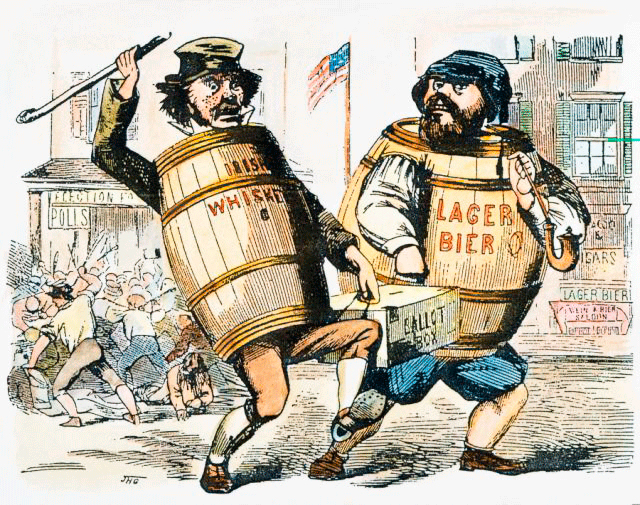
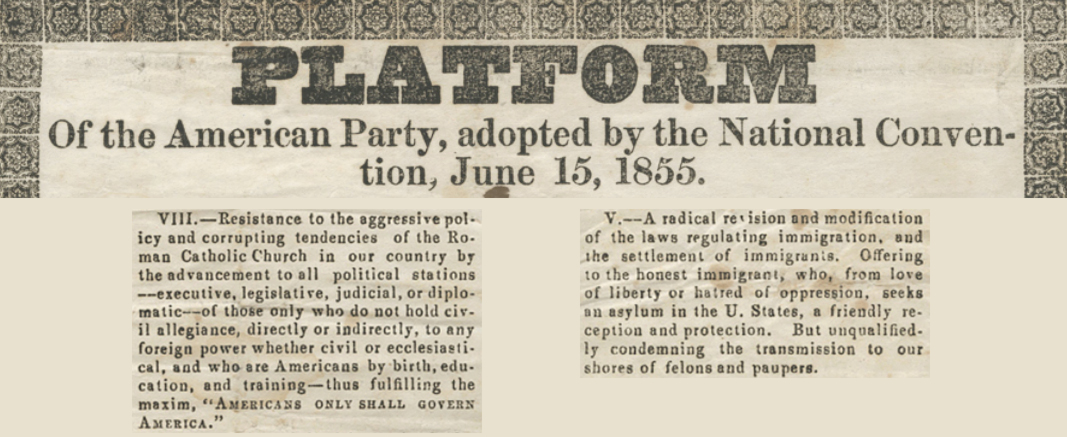
The politics of the 1850s became infected with anti-Irish/anti-immigrant sentiment as the numbers of immigrants grew and their poverty was pressed on the cities in which they settled. It found its fullest expression in the American Party. In its short history the American Party, or the "Know- Nothings," grew to briefly be the second largest political party in the country as the Whig Party split apart in the late 1840s and 1850s. Its base was working class white male Protestants - those most threatened by the growing supply of cheap labor brought by large scale German and Irish Catholic immigration. The political cartoon and the excerpts from the party's 1856 platform below suggest the strength of the sentiment against the newly arrived Irish immigrants amongst a significant segment of the population - particularly in the states experiencing the greatest influx - New York and Massachusetts.
1) Use the ship manifests above and characterize the Irish immigrants
who arrived on the Archimedes and General Scott in 1848 and 1849 as
thoroughly as you can by age, sex, occupation, and family group.
2) There were 208 total passengers aboard the two ships. Sort each
ship's manifest by age and use the available template to prepare a population graph showing a
breakdown of the population by age. Follow the example on the template
showing the percentage of the population from ages 1 - 4 (14/208 ~ 7%)
and from 5 - 9 (9/208 ~ 4%).
The Immigration
map shows the breakdown of the population by age for each state. Prepare
a population graph for New York like you did for the passengers of the
two ships of Irish immigrants. How do the two populations compare in
terms of age?
4) California and Washington Territory were also among the states with
the highest percentage of Irish immigrants in 1860. Describe how these
two regions of the country differed in terms of Irish immigration from
New York and Massachusetts. Why do you suppose the percentage of Irish
immigrants in California was so high?
5) Make a list of the Dos and Don'ts
for emigrants that Margaret
McCarthey suggests in her letter home and briefly
explain her rationale for each.
6) Describe the stereotypes to which the "Know Nothing" political
cartoon and the plank from the party platform appeal and the perceived
threat that they address.
Irish immigration data from Office of Immigration
Statistics, 2006
Yearbook of Immigration Statistics, Washington D.C.:
Department of Homeland Security, 2006.
Irish population data from O’Grada, C. (1988). Ireland before and after
the famine: Explorations in economic history 1800-1925. Manchester, UK:
Manchester University Press.
Transcriptions of passenger lists from "Irish
Ancestors: Passenger-list websites by ship's name and year," The Irish Times, 2014.
images from "Taking
a smile,"
date unknown, N. Currier, New York, as found at Library of
Congress .
"Notice
to Contractors," New York Times. May 10, 1859 as found
at Yesteryears News.
J. A. Wales, "Untitled," Puck, date unknown, found at Michael O’Malley, History
120, George Mason University.
1Boston Evening Transcript, 21 June 1847 as
found in Farrell, James M., "Reporting
the Irish Famine in America: Images of "Suffering Ireland" in the
American Press, 1845-1848" (2014) Communication
Scholarship, Paper 17.
"Know-Nothing
Political Cartoon," source unknown, ca. 1850 as found
at Granger FineArtAmerica.
“Platform
of the American Party, adopted by the National Convention, June 15,
1855,” Philadelphia: E.B. Bartlett, C.D. Deschler, and
James M. Stephens,1855 as found at Seth Kaller Historic Documents &
Legacy Collections.
Last modified in October, 2021 by Rick Thomas